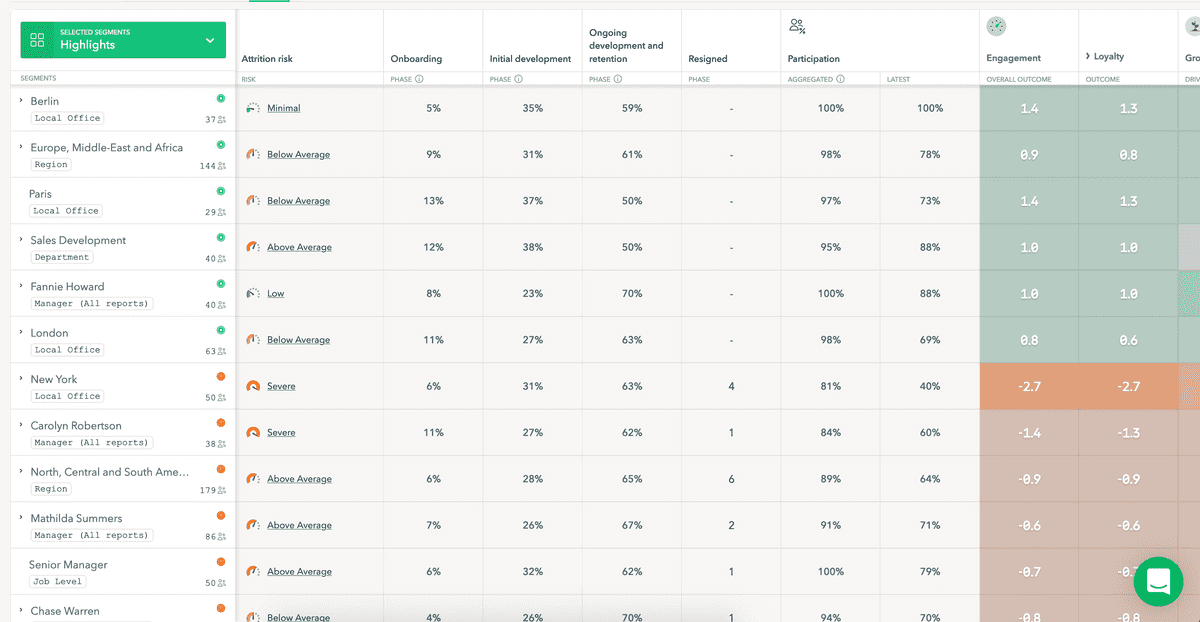
Heatmap
Rewrote the existing heatmap into a new one in React, using react-virtualized and Redux. It replaced the previous one built in Angular a few years ago. Furthermore, there were a number of new features added.
It added support for new question sets, as the first implementation only supported engagement, which was the only question set that Peakon offered at that time.
I was the single (frontend) developer working on this project, and I architected and built it entirely. The solution takes into account features that are planned in the roadmap, but weren't implemented on the first iteration. The performance was an important aspect, and in fact, there are many decisions in order to make it faster.
The heatmap supports expanding both columns and rows. When expanding columns, the user can dive into the scores of subcategories, and expanding rows, allows the user to dive into subsegments that are part of their parent segments.
Finally, it also meant reimplementing the attrition prediction feature, which was quite simple to add, given the abstraction that had been used allowed to easily plug in new renderers for the cells, to adapt to any type score / value.
Tools & Technologies
The tech stack
- react
- redux
- react-virtualized
- postcss
- JavaScript


